本文最后更新于:5 个月前
VSCodeJupyter的交互式绘图配置
安装支持库
安装完成后需要重启Jupyter服务
VSCode使用
1
2
| %matplotlib widget
import matplotlib.pyplot as plt
|
Demo
1
2
| %matplotlib widget
import matplotlib.pyplot as plt
|
1
2
3
4
5
6
7
| time = [0, 180, 240, 360, 390]
plt.figure()
plt.plot(time,[0, 15, 15, 23, 23])
plt.xticks([180, 240, 360, 390], ["3:00","4:00","6:00","6:30"])
plt.title("Before Deposition")
plt.ylabel("Power")
plt.xlabel("Time")
|
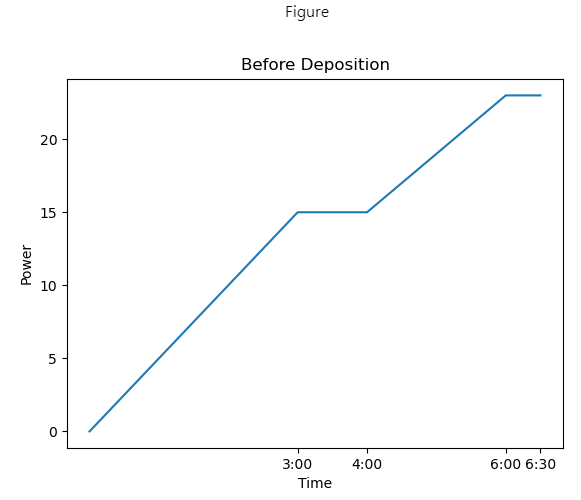 image-20230616183028835
1
2
3
4
5
6
7
| time = [0, 30, 50, 60]
plt.figure()
plt.plot(time,[23, 10, 10, 0])
plt.xticks([30, 50, 60], ["0:30","0:50","1:00"])
plt.title("After Deposition")
plt.ylabel("Power")
plt.xlabel("Time")
|
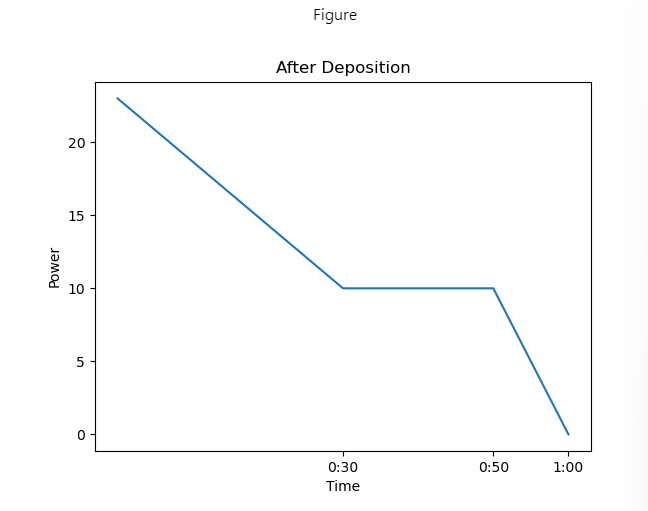 image-20230616183059631
注意事项
每次绘图时需要多加一行代码,用于创建一个新的画布
如果不新建画布,会导致不同cell之间的plt绘图共用同一张画布
也可以使用ax的方式绘图